 .
.Seismic waves from strong earthquakes affect buildings and structures in complex ways. The mechanical response of a structure depends on the technical characteristics of its members, the frequency content of the incoming wave and the reaction of the underlying soil. Complete information about the stress-strain state of structures or their individual elements under the action of seismic vibrations can be provided by dynamic analysis with the determination of the structural response in the time domain. Therefore, in the practice of earthquake-resistant construction, especially for critical and environmentally hazardous facilities, a dynamic method is applied for calculating seismic loads using real or synthesized strong ground motion accelerograms (see, for example, EN 1998 or DBN V 1.1-12:2014 ).
Instrumental records of ground motion under predicted maximum earthquakes are ideal for taking into account possible nonlinear effects under seismic loads in the direct dynamic analysis. However, in most cases it is impossible to obtain such records and synthesized accelerograms have to be used instead. They are utilized for solving both linear and nonlinear dynamic problems. The standards require using accelerogram sets in particular to plot an envelope, which can play the role of a spectrum in the linear-spectral analysis.
The following information is specified in the Synthesis tab:
The following data is specified in a separate table:
The oscillation envelope shape is specified in a separate table, where you can select its type (stationary, trapezoidal [9], exponential [7], composite [8] or Saragoni–Hart [6]).
The envelope shape (stationary, trapezoidal, exponential or composite)
is specified in a separate table. The corresponding parameters are set
for each envelope shape. After setting these parameters, you can preview
the envelope shape by clicking the button .
After clicking the Calculate button, the program synthesizes the specified number of accelerograms, which are then saved in the user-selected directory with names like <prefix><number>.spc.
Accelerograms are synthesized from a stationary random process, with parameters selected so that the acceleration response spectrum of the simulation matches the target spectrum. The resulting time-domain function is then multiplied by the specified envelope function.
While the problem of determining the response spectrum from an accelerogram is unambiguous, the inverse one is ambiguous because different accelerograms can correspond to the same spectrum with a certain degree of accuracy. Moreover, this problem does not always have a solution. If a solution is found, it is approximate and is obtained using an iterative algorithm. To avoid long (or even infinite) computation time, the maximum number of iterations is limited by the user (by default, this number is set to 30).
The following tabs become available after performing the calculation: Accelerograms, Envelope, Correlation Plot and General Properties. These tabs are similar to those in the Envelopes, Correlation and Edit modes described earlier.
This mode also enables to check a previously created set of accelerograms for compliance with the selected criteria. To do this, check the Verification Mode checkbox and choose the required set of files in the Accelerograms tab. Clicking the Calculate and Report buttons generates a report on the verification results. The contents of the report depend on whether the Short Report checkbox is checked in the Report tab and on the language settings in the Settings dialog box. The short report contains only information about the violated criteria, while the full report includes data on all the checks performed. The same applies to the synthesis report. In addition, after accelerograms have been synthesized (or a previously created set has been verified), a button appears that allows you to quickly generate a report on the results. This button invokes a dialog box containing the Short Report checkbox (duplicating the corresponding option in the settings), which allows you to quickly adjust the level of detail in the output.
As already mentioned, when synthesizing and verifying a set of accelerograms, you should specify the set of criteria that the synthesized or selected set must meet. The table below lists the checks implemented in the program (for user convenience, quotations from strandards are also included). Note that the first row of the criteria table contains a drop-down list of standards. When the required document is selected, the program automatically fills in the table with the corresponding data, which the user can then modify. It is recommended to verify that the set of frequencies or periods selected in the settings corresponds to the chosen document. If the standard provides recommendations regarding the oscillation envelope shape, these data will also be entered into the corresponding table. Note that since the envelope formulas in RB-006-98 contain errors, the program uses the Saragoni–Hart envelope, which has a similar shape.
|
Criterion |
Recommendations |
Note |
|---|---|---|---|
1. |
Maximum correlation coefficient
|
Two time histories shall be considered statistically independent if the absolute value of the correlation coefficient does not exceed 0.3 (Sec. 2.3(d) ASCE 4-98, Sec. 5.3.4 RB-006-98, Sec. 2.4(f) ASCE 43-05) |
Setting the value to 1.0 disables this check. |
2. |
Average correlation coefficient
|
Two time histories shall be considered statistically independent if the absolute value of the correlation coefficient does not exceed 0.16 (Sec. 2.6.2 ASCE 4-16) |
Setting the value to 1.0 disables this check. |
3. |
Minimum frequency for spectrum deviation check
|
In the frequency range between 0.5 and 33 Hz, the arithmetic mean of the ratios of the response spectrum values (calculated from individual accelerograms) to the design spectrum (Sec. 5.3.2 RB-006-98) At any frequency in the range between 0.2 and 33 Hz, the response spectrum of an accelerogram shall not deviate from the corresponding value of the design spectrum by more than 10% (Sec. 7.2.6.4 MR 1.5.2.05.999.0025-2011) |
|
4. |
Maximum frequency for spectrum deviation check
|
||
5. |
Balancing
|
At the end of the accelerogram, the computed velocity and displacement shall be close to zero (Sec. 7.2.6.8, MP 1.5.2.05.999.0025-2011) |
Synthesized accelerograms will be balanced |
6. |
Mean ZPA control
|
The mean of the zero-period acceleration (ZPA) values calculated from the individual time histories shall equal or exceed the design ground acceleration (Sec. 2.3(c.1) ASCE 4-98, Sec. 5.3.1 MR 1.5.2.05.999.0025-2011) |
|
7. |
Individual accelerogram ZPA control
|
The maximum amplitude of an accelerogram shall not be less than the maximum acceleration of the design spectrum (Sec. 7.2.6.3, MP 1.5.2.05.999.0025-2011) |
|
8. |
Negative spectrum deviation width control
|
The negative deviation of the response spectrum of each accelerogram shall not fall more than 10% below the target spectrum at any one frequency. To prevent spectra in large frequency windows from falling below the target spectrum, the spectra within a frequency window of no larger than ±10% centered in the frequency shall be allowed to fall below the target spectrum (Sec. 2.4(c), ASCE 43-05; Sec. 7.2.6.6, MP 1.5.2.05.999.0025-2011). |
|
9. |
Control of the mean ratios of accelerations over the entire set of accelerograms
|
The average of the ratios of the mean spectrum (calculated from the individual time history spectra) to the design (or evaluation) spectrum, where the ratios are calculated frequency by frequency, shall be equal to or greater than 1 (Sec. 2.3 (c.2) ASCE 4-98) |
Sec. 2.3(c.2), ASCE 4-98 does not specify a particular frequency range; only the frequency range of interest for structural design is mentioned. Therefore, the program uses the full frequency range. |
10. |
Control of the mean ratios of accelerations for each individual accelerogram |
The arithmetic mean of the ratios of the response spectrum of each individual accelerogram to the design spectrum shall not be less than 1 (Sec. 5.3.2, RB-006-98; Sec. 7.2.6.5, MP 1.5.2.05.999.0025-2011) |
|
11. |
Spectral power control
|
In lieu of the power spectral density requirement, the computed mean of the 5% damped response spectra shall not exceed the target spectrum by more than 30% in the frequency range between 0.2 Hz and 25 Hz (Sec.2.4 ASCE 43-05). |
|
12. |
Allowable positive deviation of accelerograms from the design spectrum
|
At any frequency in the range between 0.2 and 33 Hz, the response spectrum of an accelerogram shall not exceed the target spectrum by more than 10% (Sec. 7.2.6.4, MP 1.5.2.05.999.0025-2011) |
Setting the value to 100% disables this check. The frequency range defined in rows 3–4 of this table is used. |
13. |
Allowable negative deviation of accelerograms from the design spectrum
|
At any frequency in the range between 0.2 and 33 Hz, the response spectrum of an accelerogram shall not fall more than 10% below the target spectrum (Sec. 7.2.6.4, MP 1.5.2.05.999.0025-2011; Sec. 2.4(c), ASCE 43-05) |
Setting the value to 100% disables this check. The frequency range defined in rows 3–4 of this table is used. |
14. |
Allowable negative deviation of the mean spectrum from the design spectrum |
No one point of the mean spectrum (from the time histories) shall be more than 10% below the design (or evaluation) spectrum (Sec. 2.3 ASCE 4-98, Sec. 2.4 ASCE 43-05, Sec. 5.3.3 RB-006-98). |
Setting the value to 100% disables this check. |
When the response spectrum of an instrumental accelerogram is used as the target spectrum, the damping ratio adopted in the synthesis should correspond to the damping for which the accelerogram spectrum was derived. This requirement also applies when the target spectrum is represented by a dynamic amplification factor curve specified in the standards.
Using an external frequency set may create the following issue. The ASCE 4-98 frequency set starts at 0.5 Hz. However, if the verification set specified in MP 1.5.2.05.999.0025-2011 is adopted, the permissible deviation of accelerograms from the target spectrum shall be satisfied starting from 0.2 Hz. In practice, the ASCE 43-05 frequency set may be recommended in all cases.
When the target spectrum is represented by a dynamic amplification factor curve specified in the standards, it should generally not be expected that all prescribed requirements will be satisfied. This is due to the fact that in many documents the dynamic amplification factor curve is bounded from below at long periods (i.e. low frequencies), for example by a value of 0.8. However, at zero frequency the acceleration response spectrum is equal to zero (for any damping ratio). Consequently, in the low-frequency range it is not possible to obtain good agreement between such a target spectrum and the spectra of synthesized accelerograms. This problem often manifests itself as a violation of the requirement concerning the allowable width of negative deviations in accelerogram spectra (see item 8 of the table). In this situation, it may be recommended to disregard such a violation if it occurs only at low frequencies.
A nonzero value of the target spectrum at zero frequency may also lead to a violation of the requirement on positive deviation of synthesized accelerogram spectra (see Sec. 7.2.6.4 of MP 1.5.2.05.999.0025-2011), despite the fact that this verification is intended for frequencies starting from 0.2 Hz.
Problems with synthesis (similar to those described when using code-based target spectra) can also arise when using a target spectrum derived from a normalized spectrum (dynamic amplification factor curve) of an instrumental accelerogram. For example, if one takes an instrumental accelerogram of the Turkey earthquake on August 17, 1999, loads this accelerogram in edit mode, and uses the frequency set recommended by DBN B.1.1-12:2014 or ASCE 4-98 with a maximum frequency of 34 Hz, the resulting target spectrum at long periods will be 0.216. When using the frequency set recommended by ASCE 43-05 and MP 1.5.2.05.999.0025-2011 with a maximum frequency of 50 Hz, the target spectrum at long periods will be 0.038.
The positive deviation limit (see Sec.7.2.6.4 of MP 1.5.2.05.999.0025-2011), if established, does not allow the synthesis process to automatically use a small trick, such as synthesizing for a maximum acceleration 2% (for example) higher than the specified value and then performing the final checks for the specified maximum acceleration. However, this approach can be recommended for manual experimentation.
Statistical Independence
If accelerogram synthesis results in violations of the maximum or average correlation coefficient, it may be advisable to increase the accelerogram duration (standards impose restrictions only on the minimum duration). This recommendation can be applied provided that the oscillation envelope does not vanish after a certain point in time (e.g., an exponential envelope or a Saragoni-Hart envelope).
Large Positive Deviations
If the set of requirements is defined by selecting a standard, it is recommended to visually inspect the positions of the target spectrum and the average spectrum. For example, if ASCE 43-05 is selected as the standard, a situation may occur where the target spectrum lies well below the average spectrum and the spectra of the individual accelerograms.
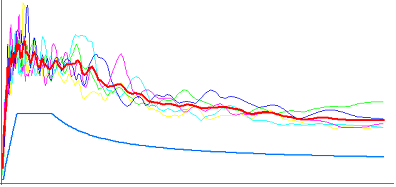
Formally, all standard requirements are met, as this document does not impose any limits on the maximum exceedance of the average spectrum over the target spectrum. In such cases, it is recommended to independently establish a requirement (see row 12 of the table above) that limits the permissible positive deviation of accelerograms from the target spectrum.
It is also recommended to check the shape of the synthesized accelerograms themselves. This recommendation is related to the following. Standards do not address this issue, except for the requirement to use an oscillation envelope (for example, a trapezoidal one). However, during synthesis it is possible to obtain an accelerogram of the following type (clearly non-physical),
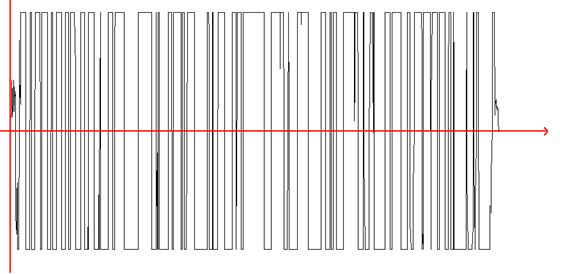
whose spectrum matches the target spectrum with high accuracy.