DECOR enables you to perform structural analysis and various checks of members and joints of timber structures for compliance with requirements of SNiP II-25-80 “Timber structures” or SP 64.13330. The application also provides reference data which is often used when designing timber structures.
The controls and procedures used to prepare data and to document the results of the analysis, which are implemented in the application, are exactly the same as those in other design and analysis applications included in the SCAD Office® system. The program uses a common multi-tab technique. To switch to a mode, click on its tab or use an appropriate menu item.
Design codes are developed as a system of checks of the known design, i.e. they solve the problem of structural assessment rather than the problem of its synthesis.
The described approach to the selection (synthesis) of the cross-section leads to designs that for one reason or another (design considerations, unification, etc.) may not satisfy the designer. He can adjust the design proposed by the program and perform its verification in the check mode.
Standard requirements (conditions of strength, general and local stability, limit slenderness, etc.) to a certain design section of a structure can be written in the form of a certain system of inequalities, each of which depends functionally on the values of internal forces \( \vec{{S}} = \{ S_{1}, S_{2}, ... , S_{n} \} \) that can arise in the considered section from the action of the design combinations of loadings:
\[ {\rm {\bf \Phi }}\left( {\vec{{S}},\vec{{R}}} \right)\le 1 ;\]
or
\[ \left\{ {{\begin{array}{*{20}c} {f_{1} \left( {\vec{{S}},\vec{{R}}} \right)\le 1;} \\ {f_{2} \left( {\vec{{S}},\vec{{R}}} \right)\le 1;} \\ {...} \\ {f_{j} \left( {\vec{{S}},\vec{{R}}} \right)\le 1;} \\ {...} \\ {f_{m} \left( {\vec{{S}},\vec{{R}}} \right)\le 1;} \\ \end{array} }} \right. ,\]
where n is the total number of possible internal forces in the section; m is the number of inequalities that describe the standard requirements; fi is a function of principal variables that implements j-th check; R are generalized resistances.
Based on the values of functions \( K_{j} =f_{j} \left( {\vec{{S}},\vec{{R}}} \right) \), we can introduce the concept of a utilization factor of restrictions, and thus represent the analysis criterion as:
\[ K_{\max } =\max \left\{ {K_{j} \quad \vert \quad j=1,...,m} \right\}\le 1 , \]
where \(К_j\) is the left-hand side of the design inequality \( f_{j} \left( {\vec{{S}},\vec{{R}}} \right)\le 1 \),
where required analyses are included. The value of Кj itself will define a reserve of strength, stability, or another regulated quality parameter available for a particular element (joint, connection, cross-section etc.). If the requirement of the design code is met excessively, then Кj is equal to the relative value of exhaustion of the design requirement (for example, Кj = 0,7 corresponds to the reserve of 30%). If the design requirements are not met, the value of Кj > 1 indicates a violation of a requirement, i.e. it describes a degree of overloading.
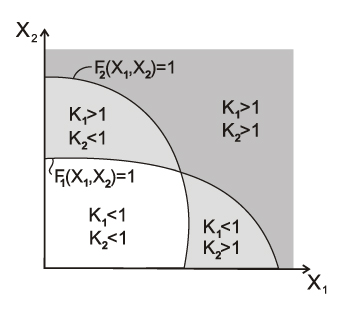
Each standard requirement \( K_{\max } =\max \left\{ {K_{j} \quad \vert \quad j=1,...,m} \right\}\le 1 \) defines a certain area Ωj in the n-dimensional space of internal forces, and the intersection of all areas Ωj forms the load-bearing capacity area of the section Ω in terms of the considered codes (Fig. 1). The maximum utilization factor of restrictions for each point of the load-bearing capacity area of the section is \( K_{\max } =\max \left\{ {K_{j} \quad \vert \quad j=1,...,m} \right\}\le 1 \).

Figure 1. Formation of the load-bearing capacity area in the two-dimensional space of internal forces
Regulatory restrictions are usually written as follows:
\[ \varphi_{j} \left( {\vec{{S}}} \right)\le \psi_{j} \left( {\vec{{R}}} \right), (j = 1, …,m), \]
where φj, ψj – functions of the main variables which implement the j-th check.
However, not all these requirements can or need to be rewritten in the form:
\[ f_{j} \left( {\vec{{S}},\vec{{R}}} \right)\le 1, (j = 1,…, m), \text {where} \] \[ f_{j} \left( {\vec{{S}},\vec{{R}}} \right)=\frac{\varphi_{j} (\vec{{S}})}{\psi_{j} (\vec{{R}})}, \]
i.e. in the form of the ratio of the left-hand side of the standard inequality to its right-hand side.
To illustrate this let’s consider formula (8.78) of SP 63.13330.2012 as an example:
\[ T\le T_{0} \sqrt {1-\left( {\frac{M}{M_{0} }} \right)^{2}}. \].
If the following ratio was calculated as the value of the utilization factor of this standard check:
\[ \frac{T}{T_{0} \sqrt {1-\left( {\frac{M}{M_{0} }} \right)^{2}} }\le 1, \]
then in the design situation when M < M0, we would obtain a root from a negative number in the denominator, and would not be able to obtain a quantitative estimate of the excess of the bearing capacity, which is avoided by transforming the formula (8.78) as follows:
\[ \left( {\frac{T}{T_{0} }} \right)^{2}+\left( {\frac{M}{M_{0} }} \right)^{2}\le 1. \]
The numerical value of the factor (the value of the utilization factor of restriction) is a measure of how fully the bearing capacity of the structural member is used (or how much it is exceeded), and as a result it allows the designer to make a correct decision about the type of the necessary design modification and only! For example, it hardly makes sense to select another steel grade with a greater design strength in the case when the stability check turned out to be critical.
It should be specially emphasized that there may be no direct proportionality between the value of the factor and the values of the forces appearing in the standard check, as there may be no direct proportionality between the value of the factor and the values of the geometric properties of the cross-sections of the structural elements. This is due to the non-linearity of the standard checks, in particular, the non-linearity of the function of the buckling coefficient, etc.
All values of the Кj factors obtained by analysis are given in the Factors Diagram dialog box or in a full report document. The respective dialog boxes display the value of Кmax – the maximal (i.e., the most dangerous) among the detected Кj values and indicate the type of check (e.g., strength, stability) in which this maximum took place.
The data given in the diagram of factors enable the designer to make a correct decision on the type of necessary structural modifications. For instance, it hardly makes sense to increase the design strength of steel if the stability check turned out to be the critical one.
Decor enables to generate the load-bearing capacity areas for sections of load-bearing bar elements of timber structures.
Sections of bar elements, where six internal forces (longitudinal force, bending moments, transverse forces, and torque) can appear under the load, have a load-bearing capacity area in the form of a six-dimensional geometric object which is very difficult to analyze. The best way to display the load-bearing capacity area of sections is by performing its orthogonal projection onto a certain plane (pair) of internal forces. The generation of a two-dimensional projection of the load-bearing capacity area of a section is performed according to the algorithm given below.
The user selects a pair of internal forces (for example, a pair “longitudinal force N – bending moment My”), in the coordinate system of which an orthogonal projection of the load-bearing area will be generated. The remaining internal forces in the section (Mz, Qy, Qz, Mx) are fixed at a certain level (they are specified by the user or take zero values). At a certain fixed value of the ratio e = My/N, the point closest to the origin is sought, where a certain inequality from the system \( {\rm {\bf \Phi }}\left( {\vec{{S}},\vec{{R}}} \right)\le 1 \) takes a limit value \( f_{j} \left( {\vec{{S}},\vec{{R}}} \right)=1 \). This point belongs to the boundary of the two-dimensional orthogonal projection of the load-bearing capacity area of the section.
This method of generating a load-bearing capacity area assumes that the area is starlike, which is a hypothesis, on the one hand, and a restriction of the software implementation, on the other hand.
Moreover, the generated area is an interactive tool for communicating with the user. Using your cursor, you can examine a two-dimensional projection of the area. A certain set of internal forces corresponds to each position of the cursor. Their values are displayed in the respective fields. Depending on the change in the position of the cursor (changes in the respective pair of internal forces), the maximum value of the utilization factor of standard restrictions-inequalities Кmax, corresponding to these forces is output, as well as the type of the inequality for which it is calculated. Clicking the right mouse button on the area enables to see the entire list of performed checks and the values of utilization factors of restrictions \( K_{j} (j=\overline {1,m} ) \) for the set of internal forces that corresponds to the cursor position. Moreover, the following operations with the mouse can be performed in the program:
One of the most important properties of the load-bearing capacity area is its convexity. It should be noted that it is the convexity of the load-bearing capacity area of the cross-section that gives us the right to limit ourselves in the linear calculation to the checks of this section for the action of only those combinations of internal forces in the cross-section for which the extreme (minimum or maximum) values are characteristic. The positive result of such checks automatically means that all other conceivable combinations of loads will be acceptable.
The absence of the convexity property of the load-bearing capacity area of the considered section can lead to many unpleasant consequences related to the fact that, traditionally, evaluating unfavorable combinations of internal forces, engineers either do not consider some actions at all (in the case when they have a unloading effect) or take them fully into account. This rule is entirely valid for a convex load-bearing capacity area, while for a nonconvex area a combination with intermediate (not extreme) values of internal forces can turn out to be an unfavorable one.
Several thousand calculations are performed during the computer-aided generation of the load-bearing capacity area of a section, which is apparently the largest check of the considered section. Moreover, the shape of the load-bearing capacity area of the section as well as the character of its boundaries in many cases enables to perform a more detailed analysis of the requirements of the codes than it can be done in other ways. The analysis of the shape of the area enables to check the consistency and completeness of the standard requirements. In this case, it is easy to identify the inconsistency of certain provisions of the codes, in particular the non-smoothness of the transition between the approximations used.
SP 64.13330.2011 Timber Structures
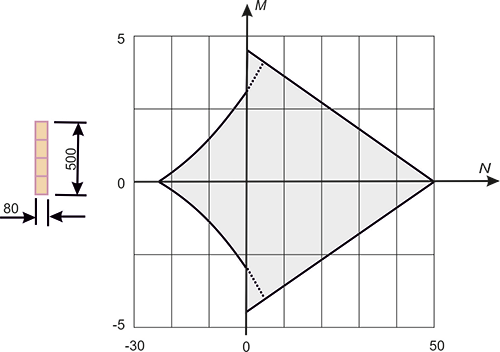
For example, let’s consider the design code for steel structures SP 64.13330.2011. Fig. 2 shows the load-bearing capacity area of a timber section (3 m long pine bar with a rectangular cross-section 500´80 mm). The jump at the transition from the area N > 0 to the area N ≤ 0 is defined by the formulations of Sec. 6.14 and 6.20 of the codes, which provide the stability check requirements only for elements under bending or under bending and compression. The codes do not consider this check for bar elements under tension and bending. However, it is obvious that if the tensile force values are very small, this check must be performed. In this case, the boundary of the load-bearing capacity area of the section would pass along the dotted curve in Fig. 2.

Figure 2. Load-bearing capacity area according to the codes for timber structures
The number of examples could be increased, but the ones given here indicate a very real situation when the load-bearing capacity area can turn out to be non-convex. As the analysis shows, in many cases there are some inconsistencies in the formulation of requirements for the bar elements of load-bearing structures, due most likely to insufficient adjustment of the formulations themselves.
The origin of such inconsistencies is related to the fact that the traditional approach based on the manual calculation generated all sorts of “simplifications”, which allowed to skip some checks or to replace the general case with a certain particular case (as at m < 20 for steel elements under bending and compression).
Moreover, the use of “logical switches” that change rules without an exact physical basis leads to an abrupt change in the algorithm, as in the classification of cross-sections in the Eurocode. Modern technologies enable to detect such inaccuracies and determine ways to improve the codes.
Dangers related to the nonconvexity of the load-bearing capacity area point to the necessity of analyzing the closeness of the set of the specified combinations of forces to the section of the boundary of the load-bearing capacity area, where the property of nonconvexity is manifested.
An almost identical analysis can be performed using additional tools
provided by SCAD Office. The following
buttons are provided for the analysis of problems related to the non-convexity
of the load-bearing capacity area: 
 . They enable to perform the following operations:
 – if the
forces are specified, clicking this button will draw the entire set of
given combinations of forces as points corresponding to the projections
of the variants of combinations of forces on the plane of the selected
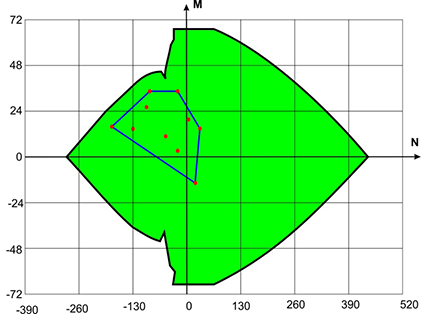
pair of forces (Fig. 3).
 – drawing
a convex hull of the points specified above, i.e. an entire set of points
which may result from a linear combination of specified forces, including
their incomplete values.
Despite the fact that these combinations were not subjected to a direct check, in the case when the convex hull of loadings does not leave the load-bearing capacity area of the section, it can be ensured that the various loadings combined from the basic ones are not dangerous.

Figure 3. Given (basic) loadings and their convex hull, combined with the load-bearing capacity area of the section

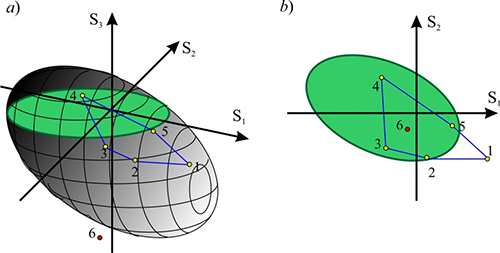
Figure 4. Illustration of possible design situations
It should be noted that the considered mechanism is a powerful tool for analyzing loading conditions, but it should be used carefully.
The load-bearing capacity area of a section is a body in the six-dimensional space of internal forces (with the coordinates N, My, Qz, Mz, Qy, T). The load-bearing capacity area is a section of the given body by a plane, and the point corresponding to the set of forces is the projection onto this plane. If the point corresponding to a certain set of forces lies within the load-bearing capacity area, it does not follow from this that all the requirements of the codes are satisfied. This is due, for example, to the fact that when generating the load-bearing capacity area (interaction curves), the restrictions of the limit slenderness are ignored (these restrictions do not depend on forces), and a situation may occur when the point belongs to the load-bearing capacity area of the section (lies in the “green area”), but the calculation will show Kmax > 1.
When operating only with two-dimensional orthogonal projections of the load-bearing capacity area, it is possible to “see” the projections of some points (combinations of internal forces) belonging to this area (for which the maximum utilization factor of restrictions does not exceed one Kmax < 1) as displayed outside the projection boundary of the load-bearing capacity area (as, for example, point 1 in Fig. 4). This can happen in the case when the Seismic checkbox is checked for the specified set of combination of internal forces, and as a result the service factor mcr > 1 was used in the calculation. And the generation of the load-bearing capacity area (interaction curves) is performed without taking into account factor mcr. A more complicated situation can arise when analyzing the interaction curves for reinforced concrete structures, since different sets of forces (points) may have different coefficients of duration.
There may also be an erroneous “vision” of a different kind, when the projection of the point lies within the boundaries of the projection of the load-bearing capacity area, and the point itself does not belong to the area (see, for example, point 6 in Fig. 4).
In order to identify such situations, the projections of the points in which the utilization factor of restrictions exceeds one, are displayed in red on the projections of the load-bearing capacity area, otherwise they are displayed in green.
In the program the Interaction Curves
tab has a button  , which enables to generate a surface
in 3D where Kmax=1
for the triple of internal forces and moments selected by the user (for
example, My-Mz-N). Clicking this button invokes
the dialog box, where you can select which force corresponds to a certain
coordinate axis (XYZ).
Clicking the Apply button will start the calculation which can be aborted by clicking the Cancel button. Once the calculation is completed, the image of the interaction surface will appear.
Controls in the left side of the window enable to
In order to change the color or font, double click on the respective cell and select the parameters.
The Wireframe model checkbox enables to obtain an image of the surface in the form of a wireframe.
Right-clicking invokes the context menu where you can select a projection.
The following operations with the mouse can be performed in the program:
 for switching to the rotation mode).