Square Membrane with a Compliant Contour
Objective: Comparison of the results of the geometrically nonlinear analysis with the experimental studies.
Initial data file: Плита-мембрана 4.SPR
Problem formulation:
The behavior of a square membrane with a support contour compliant in its plane subjected to the load uniformly distributed over the surface. It is necessary to compare the calculated data with the experimental one, when the deflection in the center and the overall picture are known.
References: G.L. Anikeev, A.Ya. Pritsker, I.N. Lebedich, Experience in Designing, Manufacturing and Testing Roofing Panels of Aluminum Alloys // Building Structures from Aluminum Alloys (Design, Research, Production) - M.: Stroyizdat, 1963
Initial data:
A membrane structure 3×3 m made of AMG-6M alloy was tested. The thickness of the membrane sheet is 1 mm, the contour is made of a bent channel 80×300×3 mm. The measurement of the prototype was performed before the tests, the initial sag of the membrane center was 1,5 mm. The test load is 100 kgf/m2. The displacements in the center were measured by the Maximov deflectometer. A very characteristic deflection pattern was noted, in which the level lines deviate far from the oval shape and are closer to a rectangular form in the vicinity of the contour.
Finite element model: The design model is assembled from shell finite elements (FE 341), the model contains 832 elements. Constraints in the Z direction were provided at the corners of the structure, and constraints along X and along Y were provided at the centers of the sides of the support contour parallel to the X and Y axes respectively.
The initial imperfection of the membrane is taken into account in the design model.
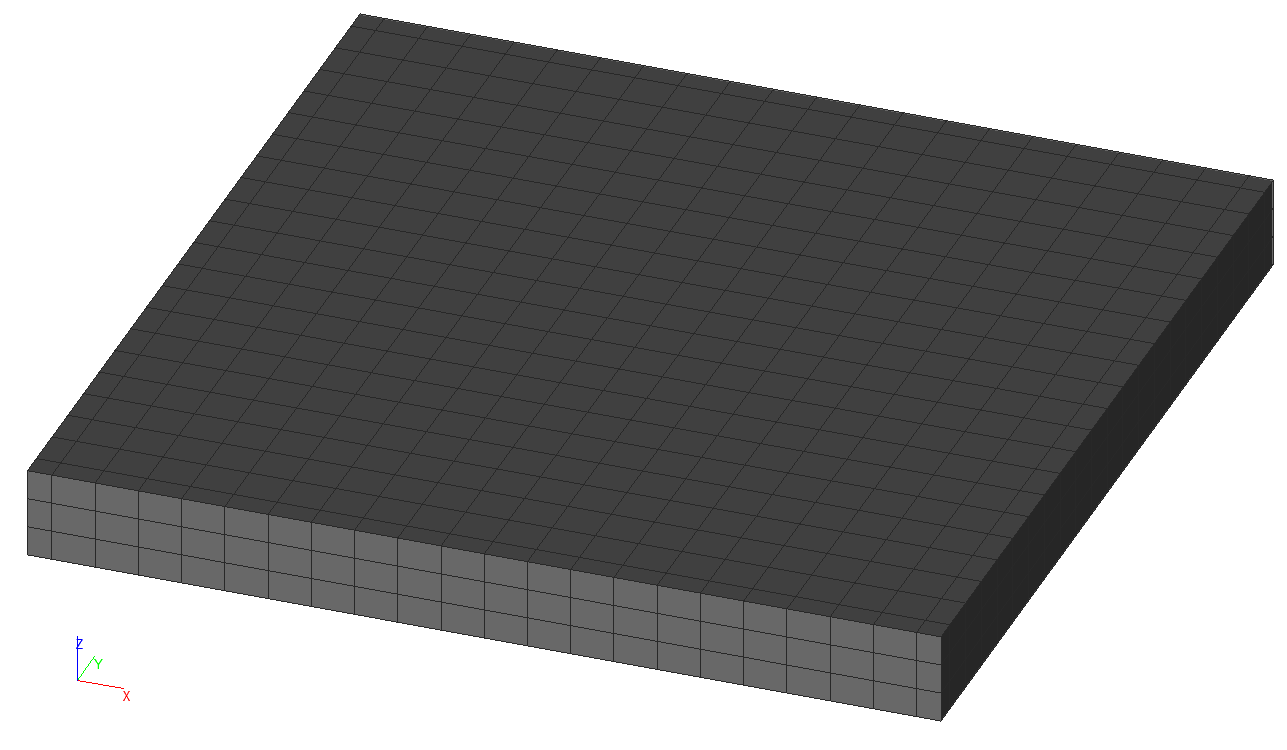
Design model
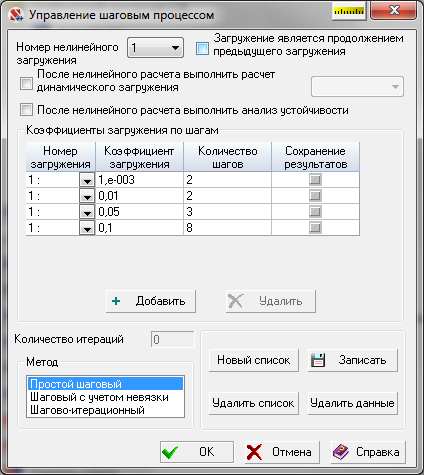
The nonlinear problem was solved by the incremental method with the steps shown in the following screenshot:
Results in SCAD
The qualitative picture of the deformation completely repeated that observed in the experiment
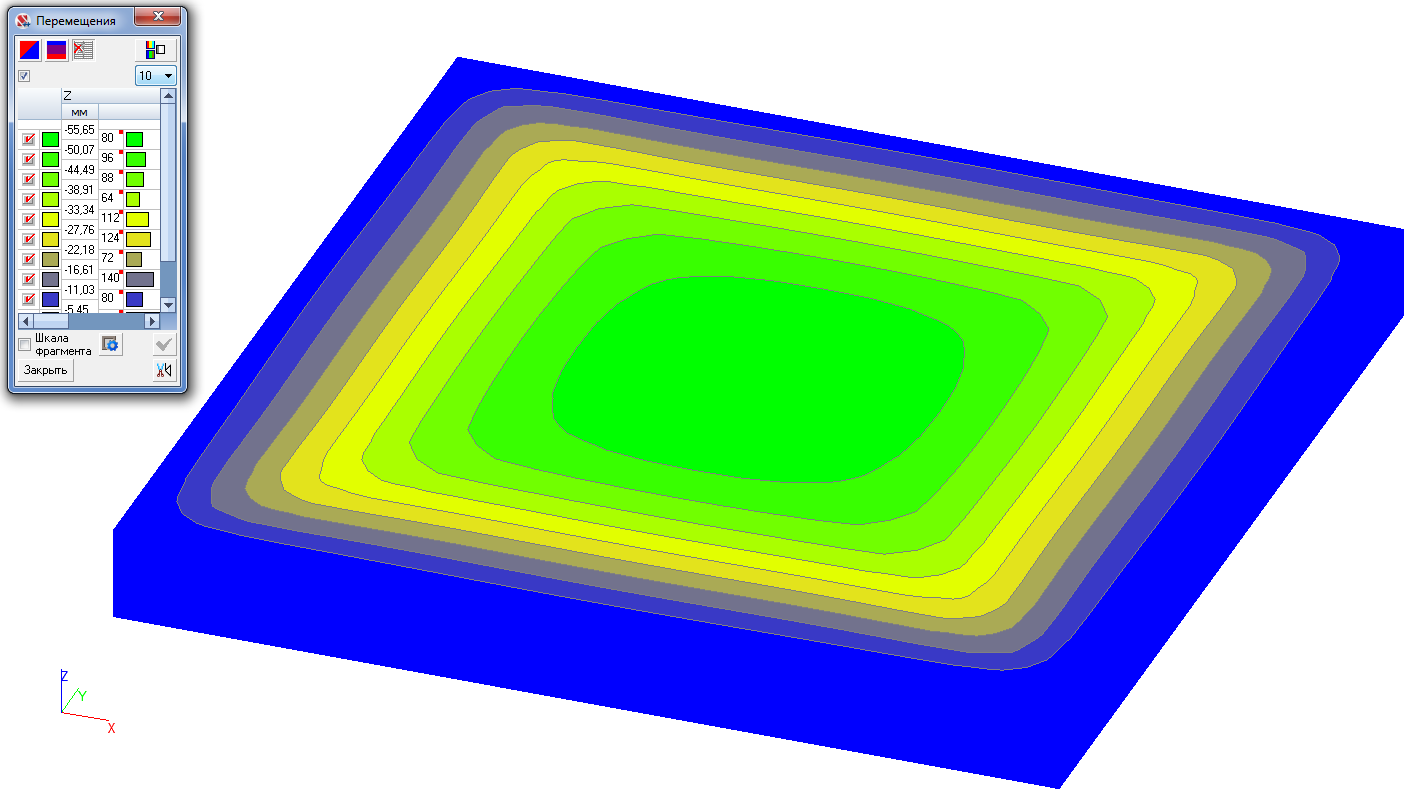
Isofields of displacements
Comparison of solutions:
|
Parameter |
Experiment |
SCAD |
Deviation, % |
|---|---|---|---|
|
Maximum displacement in the vertical direction (mm) |
59,1 |
55,65 |
5,84 |