Earthquake Accelerograms
Objective: Comparison of response spectra obtained by the Accelerogram Editor and ANSYS 2019 R3.
Initial data files:
Earthquakes.rar — accelerograms (*.spc) and ANSYS input data (*.inp);
Problem formulation: Earthquake accelerograms are considered. Response spectra for different damping ratios are analyzed.
Comparison of solutions:
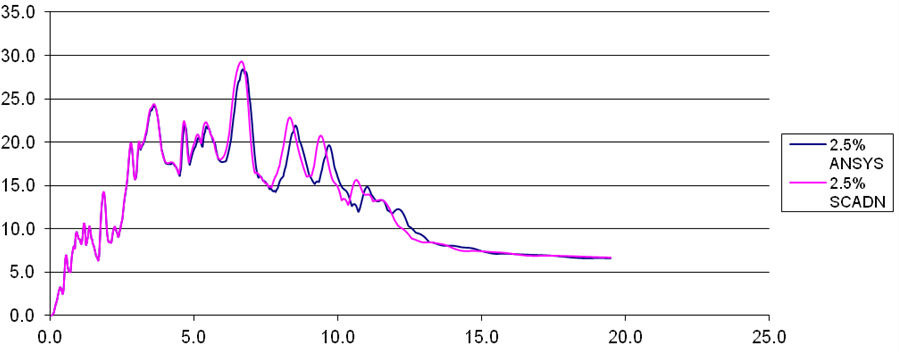
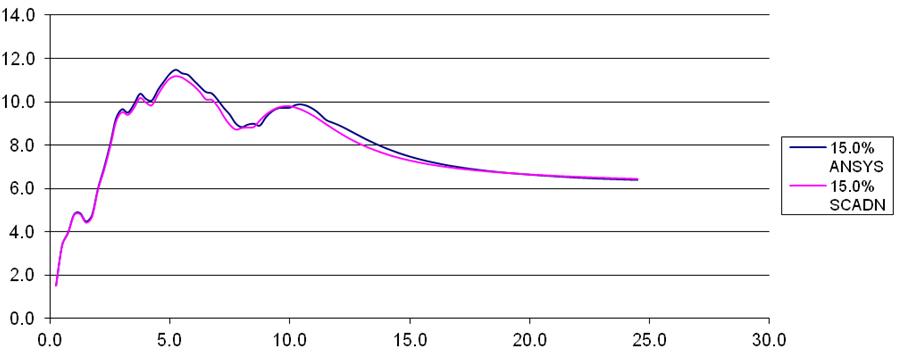
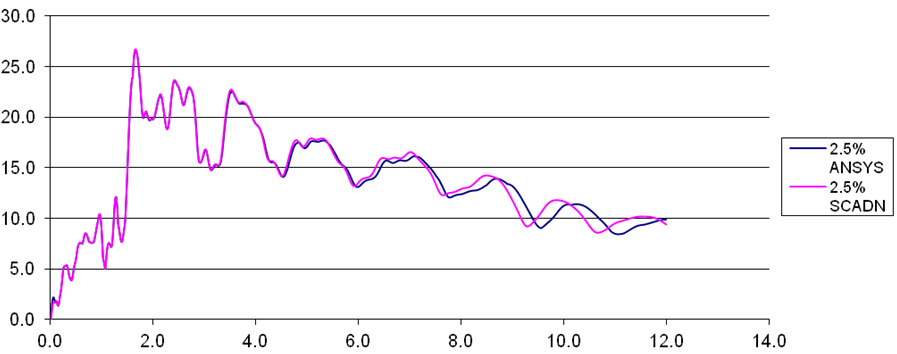
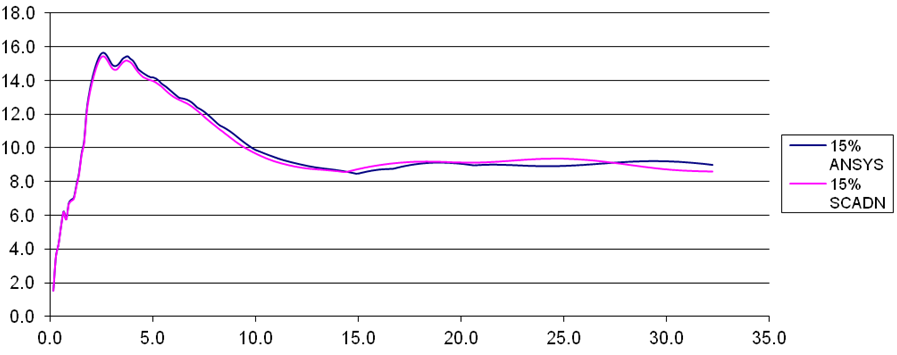
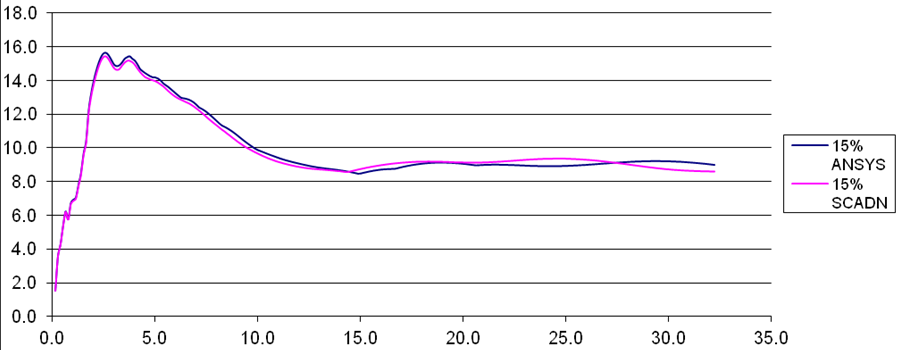
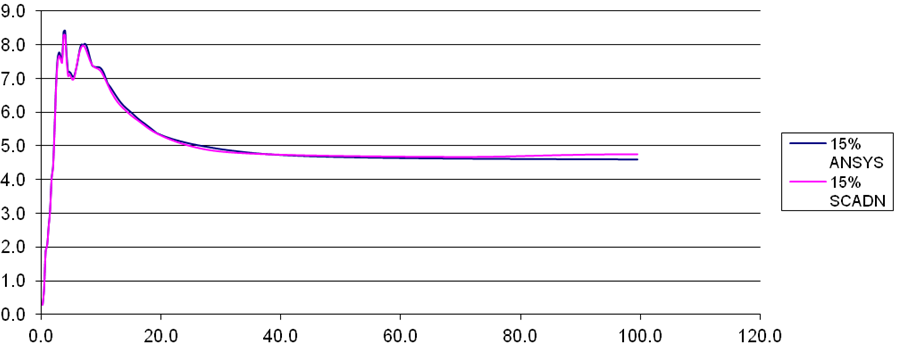
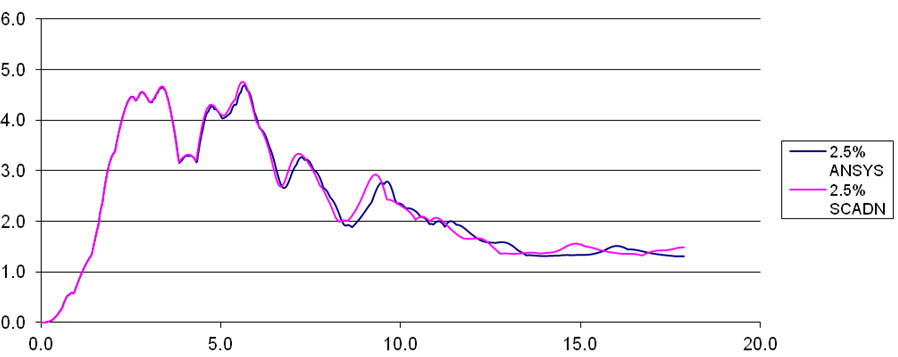
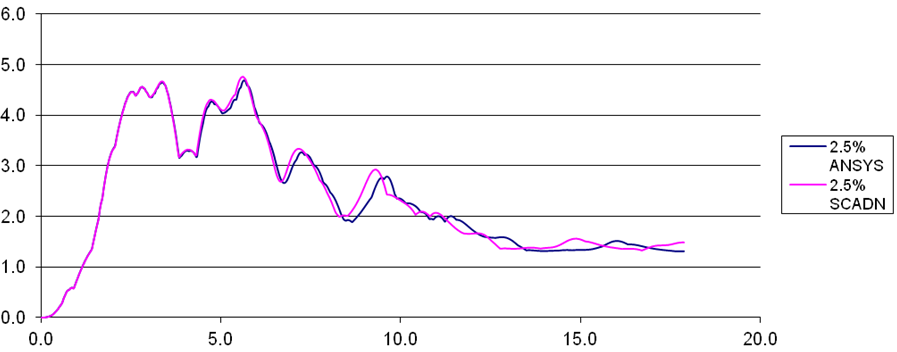
Response spectra curves for 2.5% and 15% of critical damping are shown in the figures below.
Turkey earthquake on August 17, 1999 (damping ratio 2,5%)
Turkey earthquake on August 17, 1999 (damping ratio 15%)
Chichi (Taiwan) earthquake on September 21, 1999 (damping ratio 2,5%)
Chichi (Taiwan) earthquake on September 21, 1999 (damping ratio 15%)
Italy earthquake on May 6, 1976 (damping ratio 2,5%)
Italy earthquake on May 6, 1976 (damping ratio 15%)
Hollister (USA) earthquake on November 28, 1974 (damping ratio 2,5%)
Hollister (USA) earthquake on November 28, 1974 (damping ratio 15%)
Loma Prieta (USA) earthquake on October 18, 1989 (damping ratio 2,5%)

Loma Prieta (USA) earthquake on October 18, 1989 (damping ratio 2,5%)
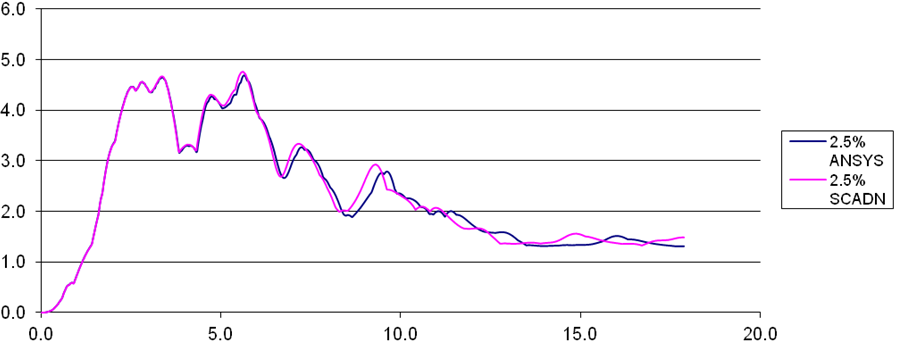
It is visually obvious that the discrepancies in the results obtained by different software are small.
Notes: Taking into account the fact that according to MR 1.5.2.05.999.0027-2011. Standards for designing nuclear power plants for earthquake resistance the response spectra should account for uncertainties (peak broadening), the results of the above computations will be identical.