Curved Hollow Section Beam of a Bridge Superstructure Subjected to a Concentrated Force
Objective: Study of the distribution of the tangential stresses and vertical displacements in a curved hollow section beam of a bridge superstructure subjected to a concentrated vertical force applied in the middle of the span above the outer web.
Initial data file: 4.35.SPR
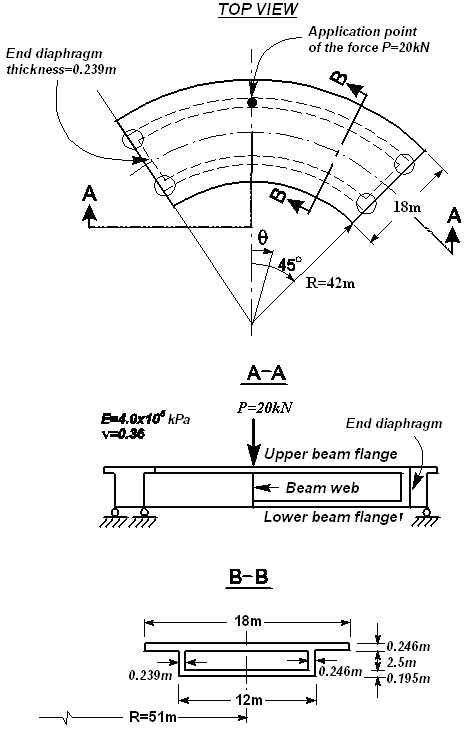
Problem formulation: The hollow section beam of a bridge superstructure with a longitudinal axis bent into a circular curve is simply supported by end diaphragms and subjected to a concentrated force P applied in the middle of the span above the outer web. Determine:
- distribution of the tangential stresses σx acting along the beam on the external surfaces and in the midplanes of the upper and lower flanges across the cross-section in the middle of the span;
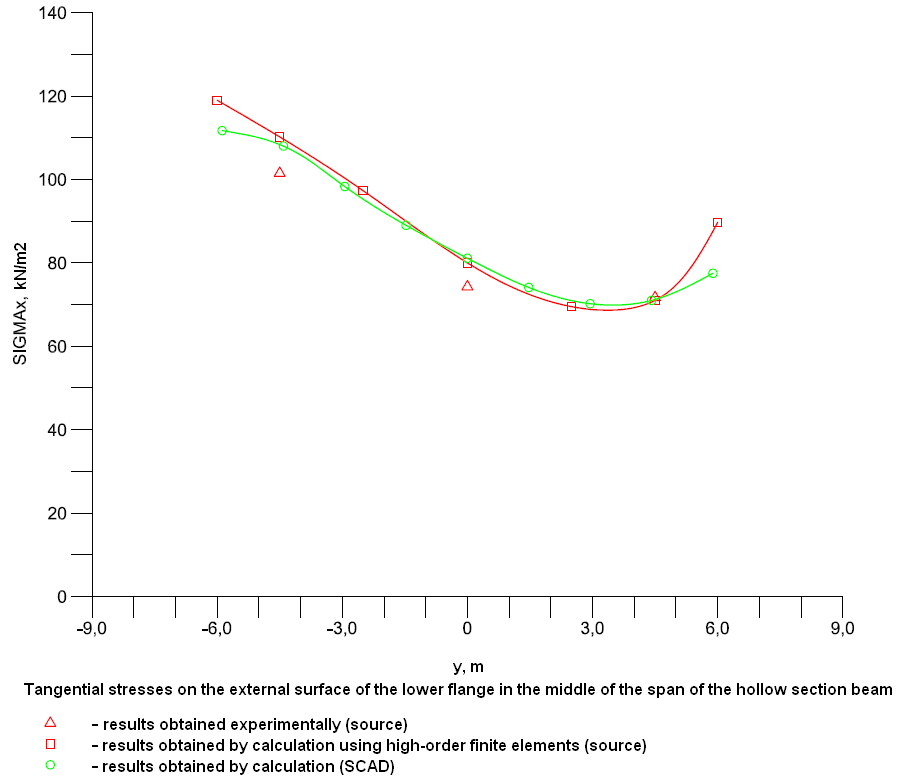
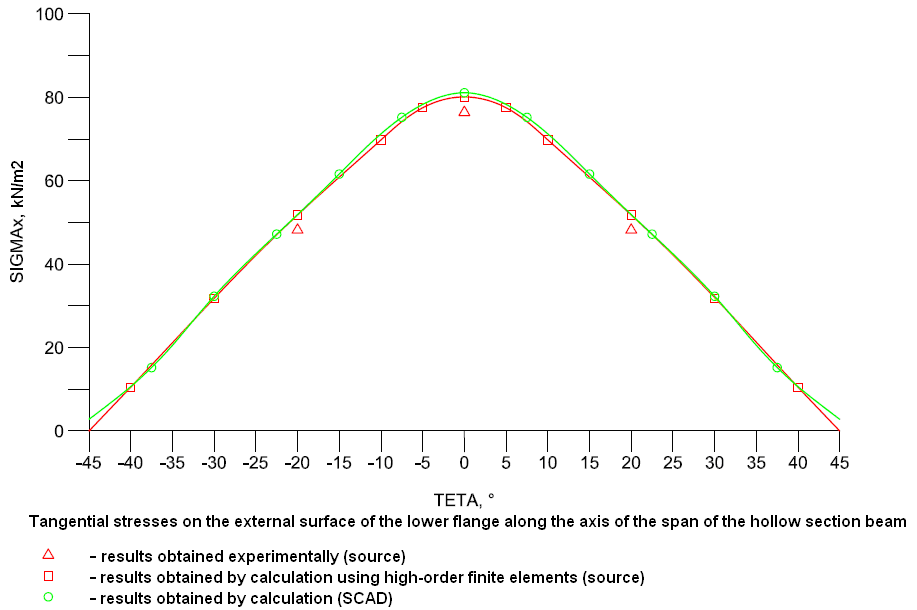
- distribution of the tangential stresses σx, acting along the beam on the external surface of the lower flange along the longitudinal axis;
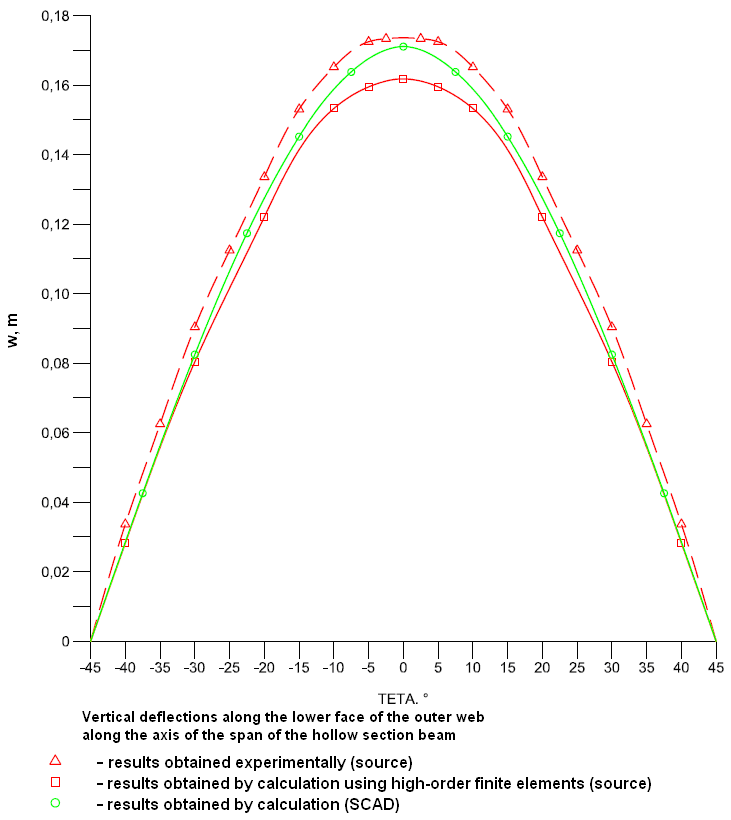
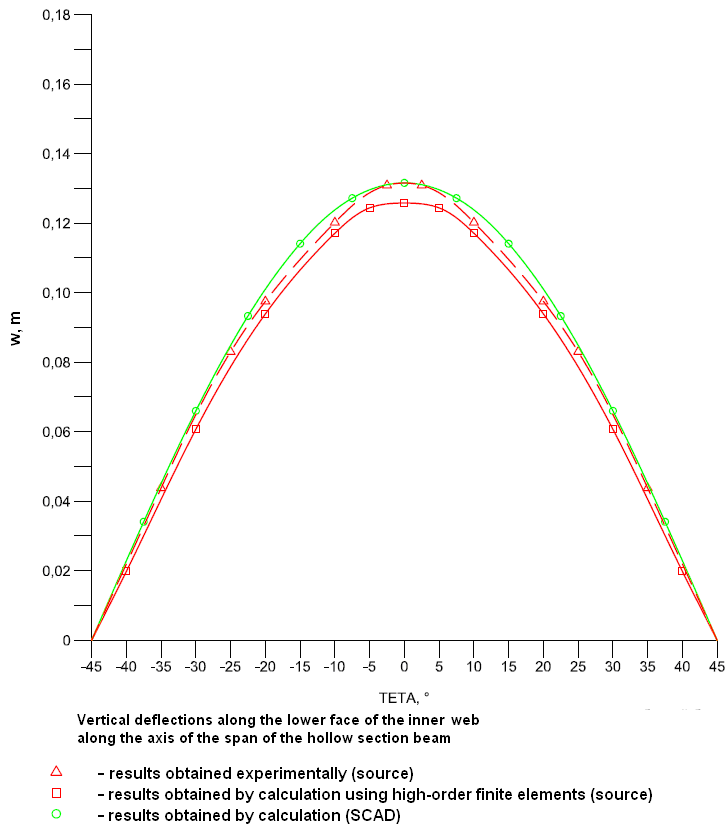
- distribution of the vertical displacements w across the lower faces of the outer and inner webs along the longitudinal axis.
References: Worsak Kanok-Nukulchai, A simple and efficient finite element for general shell analysis, Int. J. num. meth. Engng, 14, 179-200 (1979); A.R.M. Fam and C. Turkstra, Model study of horizontally curved box girder, J. Engng Struct. Div., ASCE, 102, ST5, 1097-1108 (1976).
Initial data:
| E = 4.0·105 kPa | - elastic modulus; |
| ν = 0.36 | - Poisson’s ratio; |
| R = 51.0 m | - radius of the longitudinal axis of the beam; |
| θ = 45º | - central angle containing a half of the beam span; |
| P = 20 kN | - concentrated vertical force applied in the middle of the beam span above the outer web; |
| btf = 18.0 m | - width of the upper flange; |
| ttf = 0.246 m | - thickness of the upper flange; |
| bbf = 12.0 m | - width of the lower flange; |
| tbf = 0.195 m | - thickness of the lower flange; |
| hew = 2.5 m | - height of the outer web along the inner flange surfaces; |
| tew = 0.246 m | - thickness of the outer web; |
| hiw = 2.5 m | - height of the inner web along the inner flange surfaces; |
| tiw = 0.239 m | - thickness of the inner web; |
| ted = 0.239 m | - thickness of the end diaphragm; |
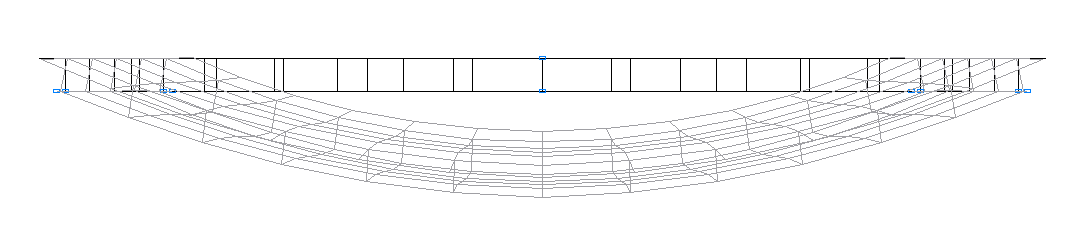
Finite element model: Design model – general type system, beam elements – 156 eight-node thick shell elements for the calculation according to the Reissner–Mindlin theory of type 150. The spacing of the finite element meshes of the upper and lower flanges in the radial direction is ~3.0 m and in the tangential direction is 7.5º. The spacing of the finite element meshes of the outer and inner webs in the vertical direction is ~2.7 m and in the tangential direction is 7.5º. The direction of the output of internal forces is radial tangential. Constraints providing simply supported conditions are installed in the vertical direction in the joints between the elements of the outer and inner webs and the elements of the end diaphragms and the lower flange. Constraints preventing the displacements of these joints in the horizontal plane in the radial direction are modeled by 4 bar elements of type 4 with the axial stiffness EF = 4.0·107 kN and the end nodes constrained in all linear degrees of freedom. The dimensional stability of the design model in the tangential direction is provided by imposing constraints according to its symmetry conditions. Number of nodes in the design model – 466.
Results in SCAD
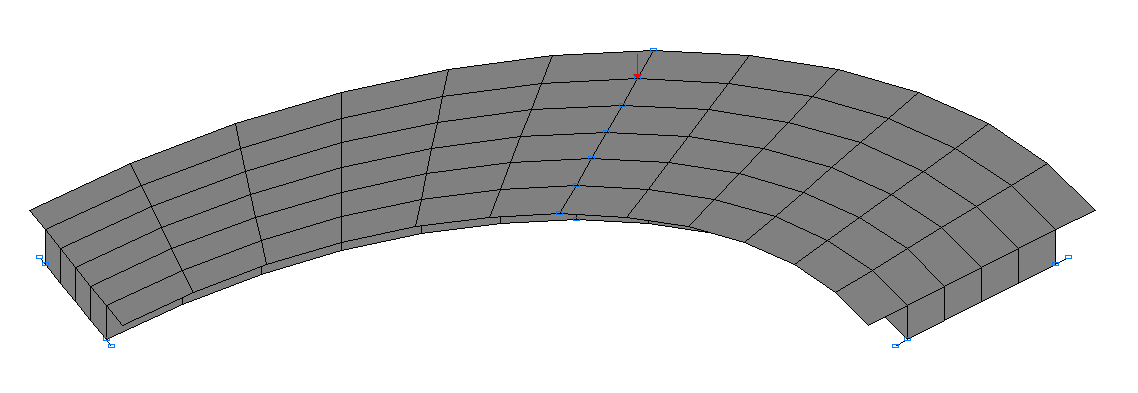
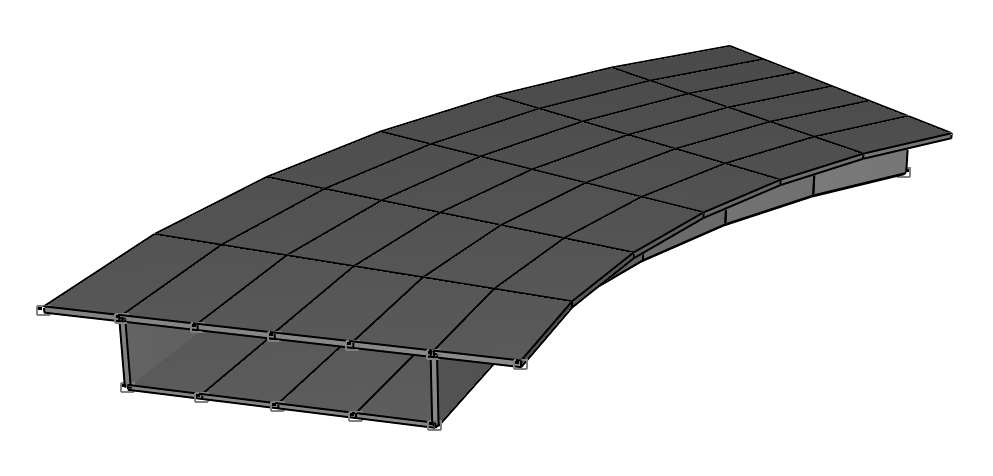
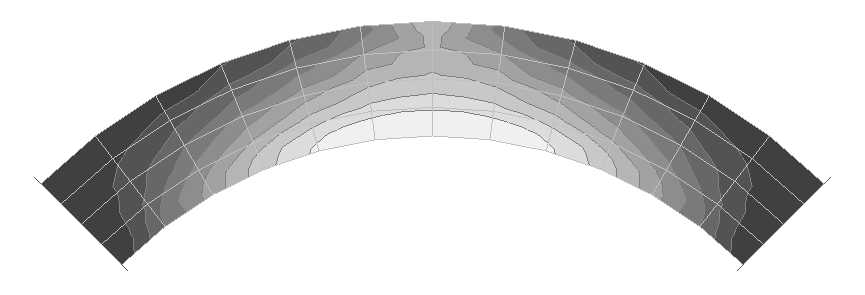
Design model
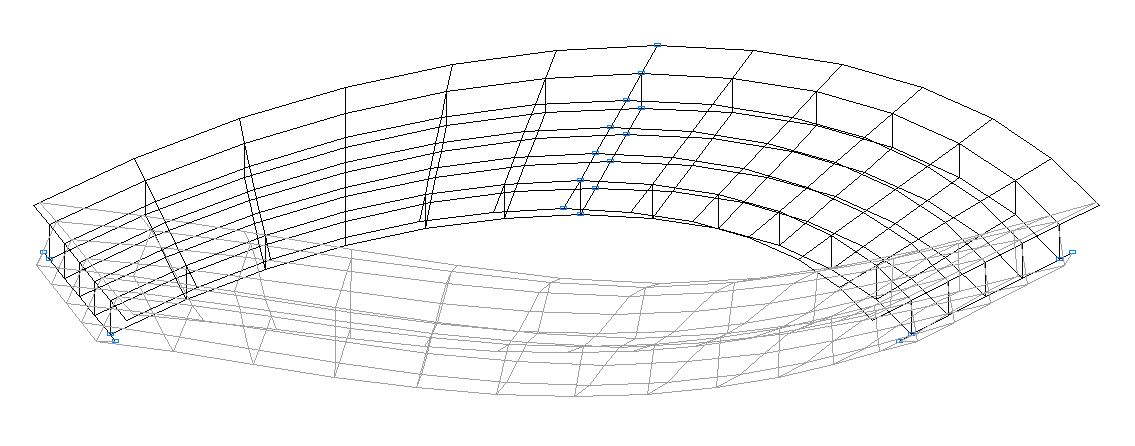
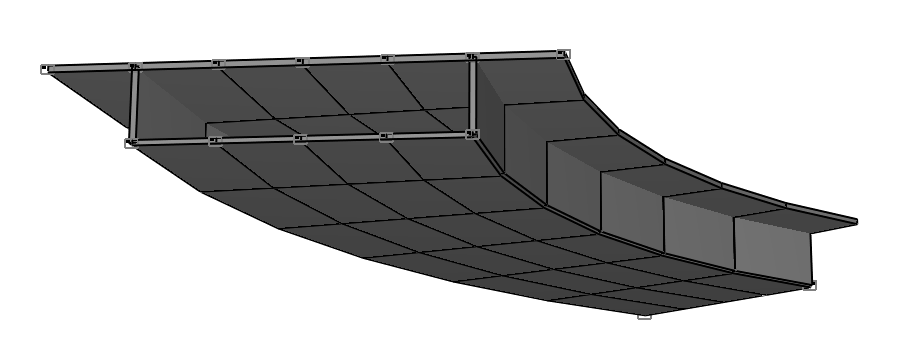
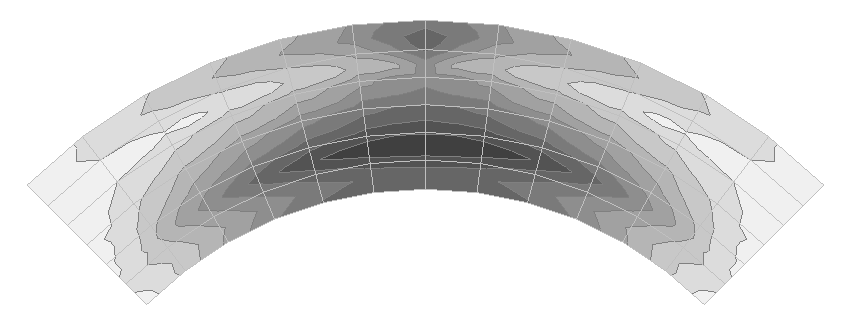
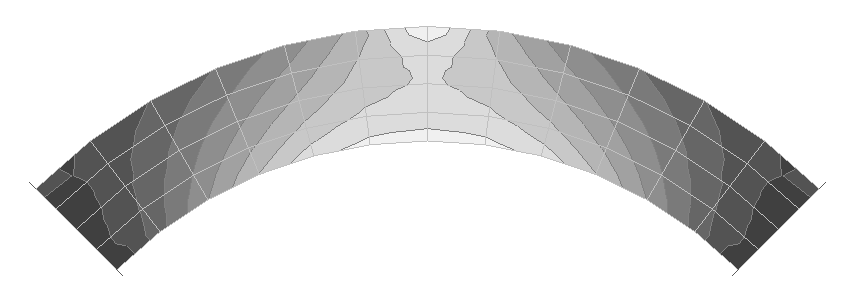
Deformed model
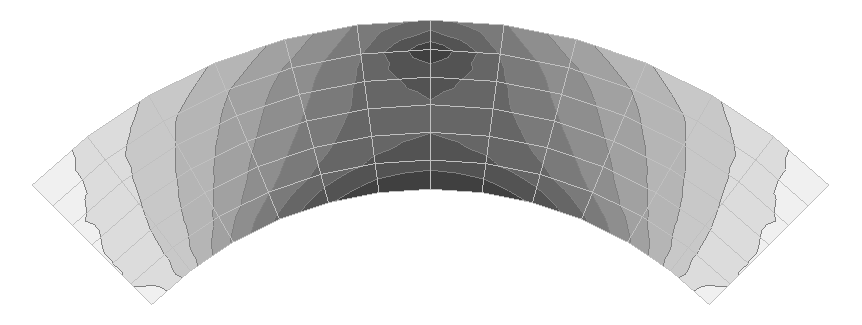
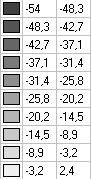
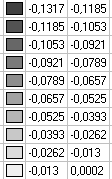
Values of tangential stresses σx, acting along the beam, in the midplane of the upper flange (kN/m2)
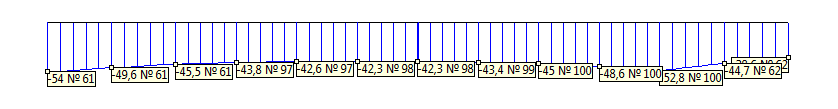
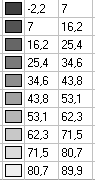
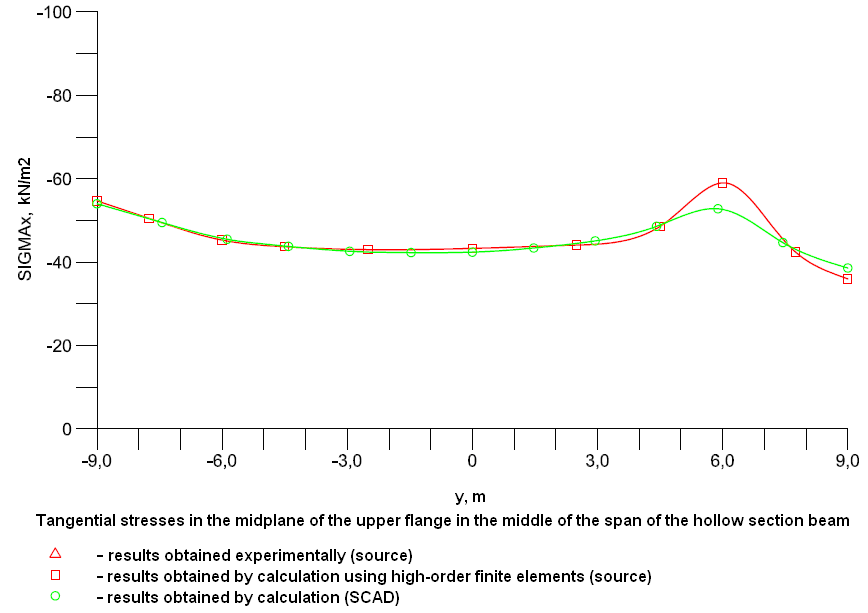
Diagram of the distribution of the tangential stresses σx, acting along the beam, in the midplane of the upper flange across the cross-section in the middle of the span (kN/m2)
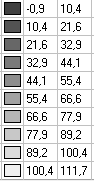
Values of tangential stresses σx, acting along the beam, on the external surface of the upper flange (kN/m2)
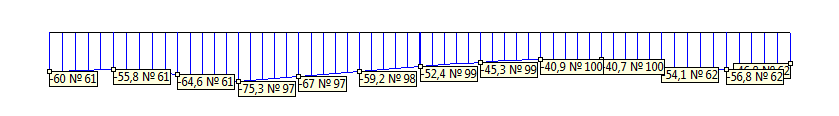
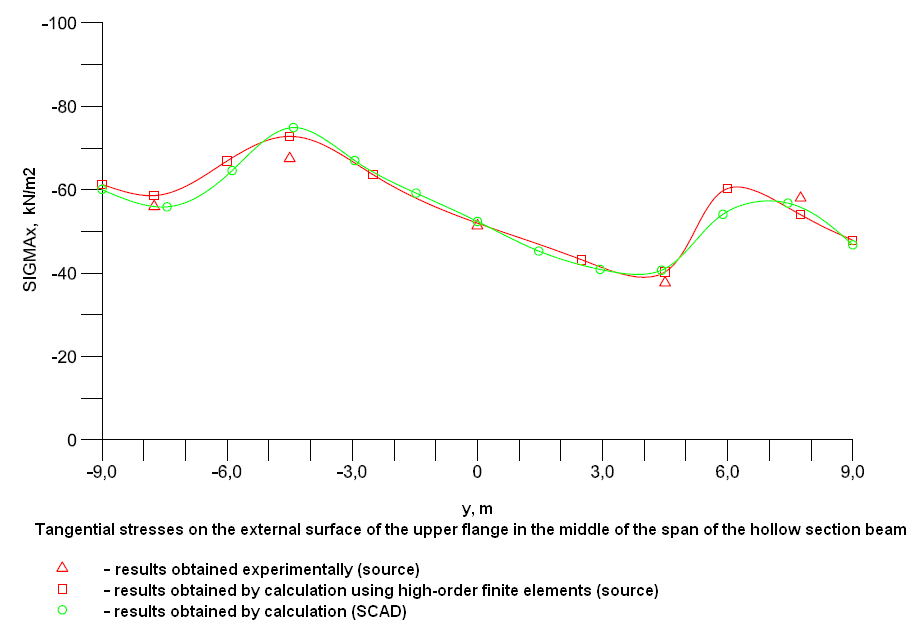
Diagram of the distribution of the tangential stresses σx, acting along the beam, on the external surface of the upper flange across the cross-section in the middle of the span (kN/m2)
Values of tangential stresses σx, acting along the beam, in the midplane of the lower flange (kN/m2)
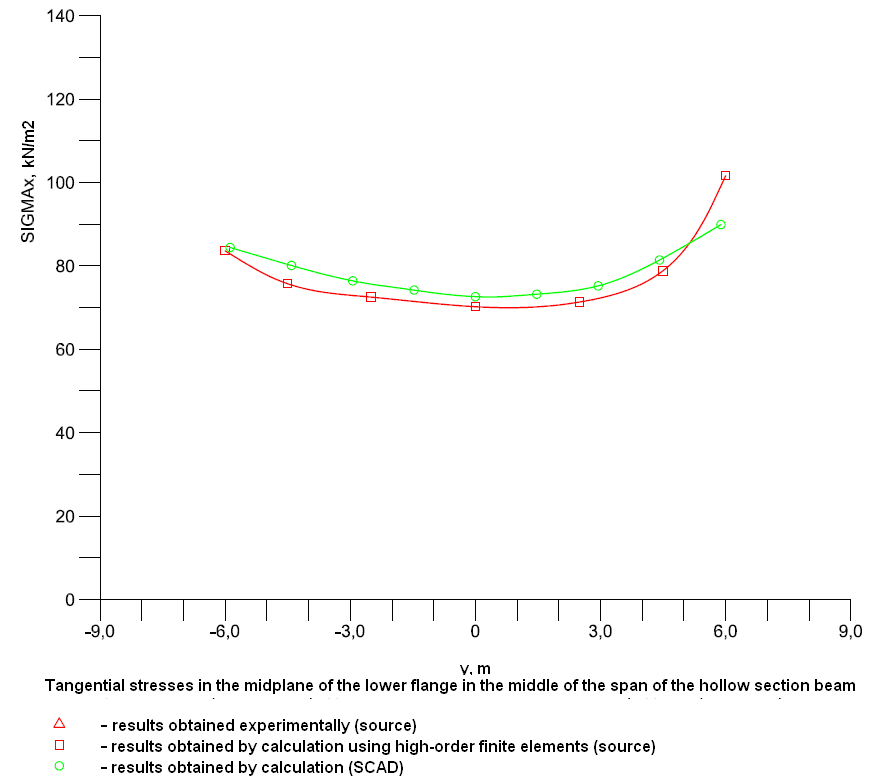
Diagram of the distribution of the tangential stresses σx, acting along the beam, in the midplane of the lower flange across the cross-section in the middle of the span (kN/m2)
Values of tangential stresses σx, acting along the beam, on the external surface of the lower flange (kN/m2)
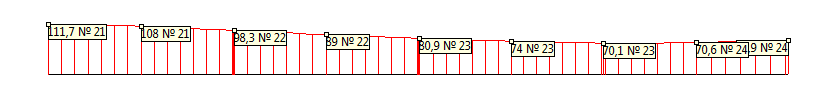
Diagram of the distribution of the tangential stresses σx, acting along the beam, on the external surface of the lower flange across the cross-section in the middle of the span (kN/m2)

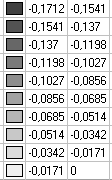
Values of vertical displacements w of the outer web (m)
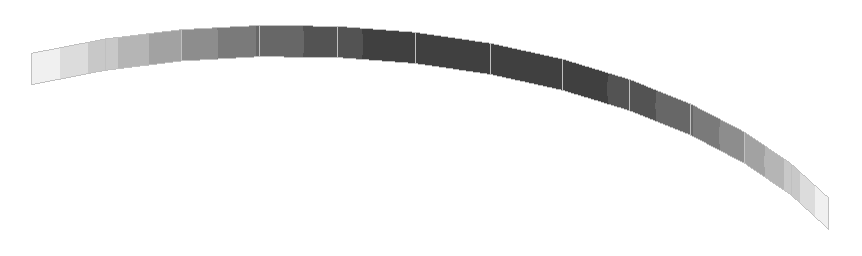
Values of vertical displacements w of the inner web (m)
Comparison of solutions:
|
y |
Experiment |
SCAD |
Deviations, % |
|---|---|---|---|
|
-7.75 |
-56.0 |
-55.97 |
0.05 |
|
-4.50 |
-67.5 |
-74.82 |
10.84 |
|
0.00 |
-51.4 |
-52.40 |
1.95 |
|
4.50 |
-37.7 |
-41.10 |
9.02 |
|
7.75 |
-58.0 |
-55.79 |
3.81 |
|
y |
Experiment |
SCAD |
Deviations, % |
|
-4.50 |
101.5 |
108.38 |
6.78 |
|
0.00 |
74.3 |
81.10 |
9.15 |
|
4.50 |
71.7 |
71.23 |
0.66 |
|
θ |
Experiment |
SCAD |
Deviations, % |
|---|---|---|---|
|
-20 |
48.2 |
51.91 |
7.70 |
|
0 |
76.4 |
81.10 |
6.15 |
|
20 |
48.2 |
51.91 |
7.70 |
|
θ |
Experiment |
SCAD |
Deviations, % |
|---|---|---|---|
|
-35 |
0.0625 |
0.05631 |
9.90 |
|
-30 |
0.0904 |
0.08250 |
8.74 |
|
-25 |
0.1125 |
0.10650 |
5.33 |
|
-20 |
0.1336 |
0.12750 |
4.57 |
|
-15 |
0.1531 |
0.14520 |
5.16 |
|
-10 |
0.1652 |
0.15887 |
3.83 |
|
-5 |
0.1725 |
0.16762 |
2.83 |
|
-2.5 |
0.1734 |
0.17016 |
1.87 |
|
2.5 |
0.1734 |
0.17016 |
1.87 |
|
5 |
0.1725 |
0.16762 |
2.83 |
|
10 |
0.1652 |
0.15887 |
3.83 |
|
15 |
0.1531 |
0.14520 |
5.16 |
|
20 |
0.1336 |
0.12750 |
4.57 |
|
25 |
0.1125 |
0.10650 |
5.33 |
|
30 |
0.0904 |
0.08250 |
8.74 |
|
35 |
0.0625 |
0.05631 |
9.90 |
|
θ |
Experiment |
SCAD |
Deviations, % |
|---|---|---|---|
|
-35 |
0.0438 |
0.04510 |
2.97 |
|
-25 |
0.0830 |
0.08487 |
2.25 |
|
-20 |
0.0975 |
0.10101 |
3.60 |
|
-10 |
0.1202 |
0.12384 |
3.03 |
|
-2.5 |
0.1309 |
0.13108 |
0.14 |
|
2.5 |
0.1309 |
0.13108 |
0.14 |
|
10 |
0.1202 |
0.12384 |
3.03 |
|
20 |
0.0975 |
0.10101 |
3.60 |
|
25 |
0.0830 |
0.08487 |
2.25 |
|
35 |
0.0438 |
0.04510 |
2.97 |